Star Observatories are specialized facilities built to collect and study light from distant objects. They may sit on quiet mountains, dry deserts, or orbit above Earth’s atmosphere. Their purpose is not simply to produce beautiful images. They help scientists measure stars, planets, galaxies, and changing cosmic events with controlled precision.
A modern observatory uses telescopes, mirrors, detectors, and computer systems. A large curved mirror gathers faint light and directs it toward an instrument. The detector converts that light into measurable data. Spectrographs can separate light into colors, revealing an object’s temperature, chemical elements, and movement. Radio observatories work differently. They collect invisible radio signals through large antenna dishes. Space telescopes avoid much of Earth’s atmospheric distortion. Weather still matters.
Researchers must calibrate instruments, remove electronic noise, and compare results with established models. Many observatories also use adaptive optics, which adjust mirrors rapidly to reduce atmospheric blurring. A scientist may spend hours checking one unusual signal before accepting it as real. That careful process protects astronomy from attractive but misleading conclusions. Light travels far.
The work is powerful, but not flawless. Clouds, equipment limits, data gaps, and human assumptions can affect observations. Even a famous observatory requires independent analysis and repeated measurements. Public observatories also offer visitors a direct experience: a dark dome, a humming telescope, and a bright image on a monitor. Understanding how these facilities operate makes space science more credible and more tangible. The universe remains complex. That uncertainty is part of the discovery.
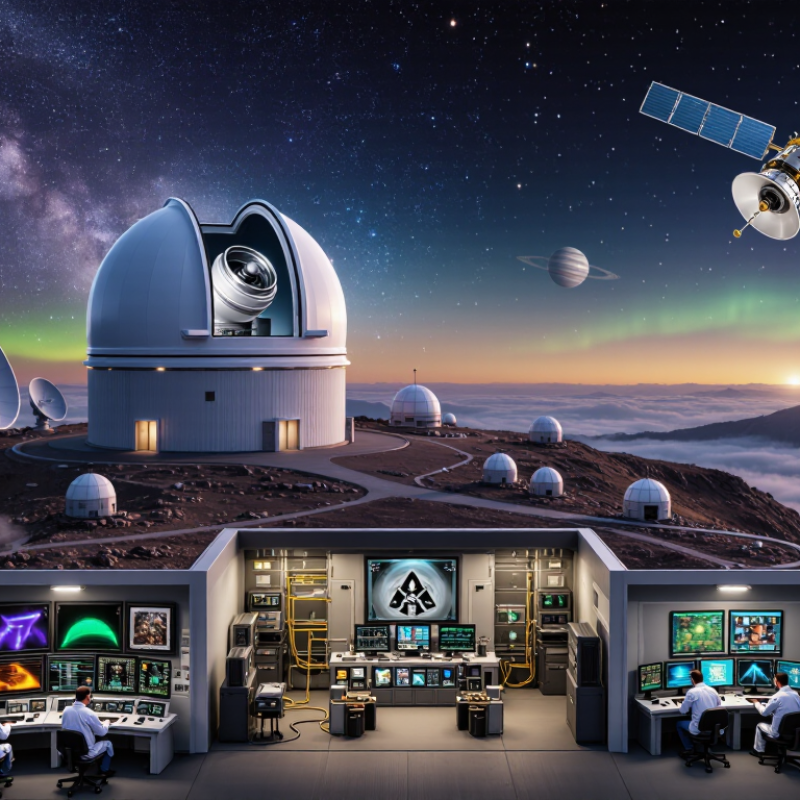
A star observatory is a facility designed to collect and study light from stars and other celestial objects. It may sit on a dry mountain, operate in orbit, or use antennas across a remote plain. Its central instrument is a telescope, which gathers faint radiation with mirrors, lenses, or radio dishes. The observatory then turns that signal into measurements, images, and spectra.
A larger mirror usually captures more light. That matters when astronomers examine a dim star, a distant galaxy, or a planet crossing its star. Detectors record details that human eyes cannot see, including infrared and ultraviolet wavelengths. The 2020 Astronomy and Astrophysics Decadal Survey emphasizes time-domain observations, because changing objects can reveal explosions, stellar mergers, and shifting magnetic activity. These events may last minutes or decades.
Location is equally important. The World Atlas of Artificial Night Sky Brightness reported in Science Advances that more than 80% of people live under light-polluted skies. That glow weakens optical observations. Dry air also reduces water vapor, which can absorb infrared radiation. Adaptive optics can correct atmospheric turbulence, though the results are never perfect.
I have found that a clean image can still hide difficult calibration choices. An observatory is not simply a large telescope under a dome; it is a carefully controlled measurement system, and its conclusions depend on instruments, software, weather, and human judgment.
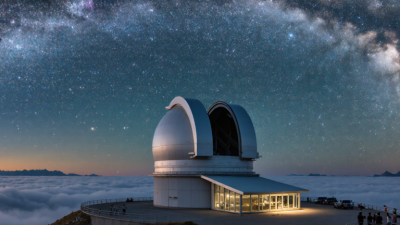
A star observatory is a carefully aligned system for collecting and studying faint light. Its most visible part is often the dome, which protects the telescope from rain, dust, and strong wind. A narrow opening allows the instrument to view the sky. The dome must rotate smoothly, although small alignment errors can still affect observations.
The telescope is the observatory’s main light collector. Large mirrors or lenses gather distant starlight and focus it into a sharp image. A rigid mount holds the telescope and moves it across the sky as Earth turns. Tracking motors make this movement extremely precise. Without tracking, a star would slowly become a blurred streak. The foundation matters too. Tiny vibrations from nearby vehicles can weaken an otherwise excellent image.
Behind the telescope, detectors record the incoming light. Digital sensors measure brightness, while filters separate selected colors. A spectrograph spreads light into a pattern of lines, helping researchers estimate a star’s temperature, motion, and chemical elements. Computers control timing, pointing, and data storage, but human judgment remains important. Clouds may appear suddenly. Sensors can also produce misleading readings. Good observers compare repeated exposures, inspect calibration images, and question results that look unusually perfect. Even advanced equipment has weaknesses. That is worth remembering.
A star observatory is a carefully engineered light-collecting system. Its mirror or lens gathers faint photons and focuses them onto a detector. Filters separate wavelengths, while a spectrograph spreads light into colored lines. Those lines reveal temperature, chemical elements, rotation, and motion. A single photon may travel for years before reaching the instrument.
The raw signal is rarely clean. Atmospheric turbulence blurs images, and air absorbs some infrared and ultraviolet light. Astronomers remove detector noise, correct uneven sensitivity, and compare observations with calibrated reference sources. They also record exposure time, sky brightness, and instrument temperature. Small errors matter. A tiny calibration mistake can imitate a planet or distort a star’s chemical profile.
Professional surveys show the scale of this work. The Astro2020 decadal survey identified time-domain observations and data-intensive analysis as major priorities for modern astronomy. A 2022 stellar data release measured positions, motions, and brightness for nearly 1.8 billion celestial sources. Machine-learning tools now help classify these enormous datasets, but human review remains necessary. The algorithms are fast. They are not infallible. A spectrum still needs physical interpretation, careful comparison, and sometimes a second observation.
| Observatory Type | Main Wavelength Range | Primary Light Collector | Typical Instrument | How Starlight Is Recorded | Common Analysis Methods | Information Revealed |
|---|---|---|---|---|---|---|
| Optical | Approximately 400–700 nanometers | Curved mirrors or lenses that focus visible light | Digital camera, photometer, or spectrograph | Photons are converted into electrical signals by a light-sensitive detector and stored as an image or measurement | Image calibration, aperture photometry, astrometry, and spectral-line measurement | Brightness, color, position, motion, temperature, and chemical composition |
| Infrared | Approximately 700 nanometers to 1 millimeter | Reflective telescope system with cooled optics and detectors | Infrared camera or infrared spectrograph | Detectors measure heat-related infrared photons; cooling reduces unwanted thermal background | Background subtraction, thermal calibration, imaging, and infrared spectroscopy | Cool stars, dust-enshrouded regions, molecules, and heat emitted by astronomical objects |
| Ultraviolet | Approximately 10–400 nanometers | Specialized mirrors coated for ultraviolet reflection | Ultraviolet imaging detector or spectrograph | Ultraviolet photons create electronic signals in detectors designed for short wavelengths | Flat-field correction, wavelength calibration, imaging, and line-ratio analysis | Hot stars, energetic gas, stellar activity, and recent star formation |
| X-ray | Approximately 0.01–10 nanometers | Nested grazing-incidence mirrors that redirect X-rays at shallow angles | X-ray camera or dispersive spectrometer | Individual high-energy photons are counted, positioned, and often assigned measured energies | Event filtering, exposure correction, spectral fitting, and timing analysis | Extremely hot gas, compact objects, shock waves, and energetic accretion processes |
| Radio | Approximately 1 millimeter to many meters | Parabolic antenna, antenna array, or multiple dishes working together | Receiver, correlator, or radio spectrometer | Radio waves are converted into electrical signals and digitally sampled for processing | Fourier transformation, interferometric imaging, calibration, and polarization analysis | Cold molecular gas, magnetic fields, pulsars, jets, and large-scale cosmic structures |
| Submillimeter | Approximately 0.1–1 millimeter | Large precision dish with highly sensitive low-temperature receivers | Bolometer array or heterodyne spectrometer | Detectors measure tiny changes in incoming radiation; spectral systems separate narrow molecular features | Atmospheric correction, continuum mapping, and molecular-line analysis | Cold dust, star-forming clouds, and the chemical composition of interstellar gas |
| Space-Based | Depends on the instrument; can cover ultraviolet, visible, infrared, X-ray, and other bands | Mirror, lens, antenna, or specialized collector above most of Earth’s atmosphere | Imaging camera, spectrograph, photometer, or high-energy detector | Light is detected without most atmospheric absorption, turbulence, or air-glow interference | Detector calibration, pointing correction, cosmic-ray removal, and multiwavelength comparison | Sharper images and access to wavelengths blocked or strongly weakened by the atmosphere |
| Ground-Based Adaptive Optics | Usually visible and near-infrared wavelengths | Ground-based mirror combined with a rapidly adjustable optical surface | Wavefront sensor and deformable mirror | A reference star or artificial guide source measures atmospheric distortion so the mirror can compensate in real time | Wavefront reconstruction, image restoration, and precise photometry or astrometry | Sharper views of stars, planets, stellar clusters, and galactic centers |
| Time-Domain Observatory | Any wavelength that can be repeatedly monitored | Fast-pointing telescope, camera, or detector array | High-speed camera, photometer, or transient alert system | Repeated exposures create a time series showing how an object changes | Difference imaging, light-curve construction, periodicity searches, and automated alerts | Variable stars, eclipses, stellar explosions, transits, and short-lived cosmic events |
Star observatories are scientific facilities that collect light and other signals from space. Their designs depend on the wavelength being studied. Optical observatories use mirrors to capture visible starlight. Infrared observatories detect cooler objects, such as forming stars and distant galaxies. Radio observatories measure long waves that pass through dust clouds. The 2020 Astronomy and Astrophysics Decadal Survey recommends combining ground and space observatories, because each environment reveals different evidence.
Ground-based observatories offer large mirrors and easier maintenance. However, Earth’s atmosphere blurs images and absorbs some infrared radiation. Space observatories avoid this problem, producing sharper data above atmospheric turbulence.
Solar observatories use narrow filters to examine flares, sunspots, and magnetic fields. Radio arrays work differently. Several separated antennas combine signals through interferometry, creating a virtual telescope with a much wider baseline.
The National Academies’ Astro2020 report also emphasizes multi-messenger astronomy, which compares light, gravitational waves, and particle signals. This approach is powerful, but not always simple.
Tips: Match the observatory to the question. Use infrared data for hidden stellar nurseries, radio data for cold gas, and optical data for visible surfaces. Check calibration notes and atmospheric conditions before trusting an image. A beautiful picture can still contain uncertainty. That part is easy to forget.
What Are Star Observatories and How Do They Work?
Astronomers use observatories as precise instruments, not simply giant telescopes. Light enters through mirrors, lenses, or radio dishes. Detectors record brightness, color, timing, and movement. The signal is fragile. Atmospheric turbulence can blur images, while heat creates unwanted infrared noise. Calibration comes first. Researchers compare observations with standard stars, dark exposures, and instrument measurements. This process turns raw pixels into scientifically useful data.
Observatory data helps astronomers test ideas about stars, planets, galaxies, and cosmic evolution. A spectrum can reveal chemical elements through narrow absorption lines. Repeated images can expose a planet’s transit or a star’s changing brightness. The 2021 astronomy decadal survey projects future surveys producing roughly ten million transient alerts each night. Automated software must filter these events before experts inspect them. Human judgment still matters, especially when signals are incomplete or unusual.
Professional workflows also include uncertainty analysis. Astronomers attach error ranges to distance, temperature, and mass estimates. The 2024 global exoplanet statistics report records more than 5,500 confirmed planets, yet confirmation requires repeated measurements and independent checks. A convincing graph can still hide a calibration problem. That weakness deserves attention. Researchers compare instruments, archive processing steps, and publish methods for reproduction. Even then, weather losses, detector defects, and selection bias can shape the final dataset. Observatories reveal the universe, but their data always carries traces of how it was collected.
Astronomical observatories collect electromagnetic radiation with specialized detectors. This chart shows the approximate wavelength ranges used in major branches of observational astronomy. Visible light and some radio wavelengths can reach the ground, while much of the ultraviolet, X-ray, and gamma-ray spectrum requires space-based observatories because Earth’s atmosphere absorbs it.